The Moma Coastal Fisheries Development Project, PNG
This project included participatory techniques for obtaining information from local fishers and householders, but it was also a good example of how government agencies can work together with each other, and of sound planning. The selection and use of indicators and targets of success that were tied to the goals of the project was also well done. In future, one would expect even more community input into these indicators and targets. But for the Pacific islands, this was a good start. Like all such projects, however, it was not "home grown" but initiated and funded by a foreign aid program.
Measurable targets are important for economic planning for sustainable development. The process of selecting indicators and monitoring their change towards pre-defined targets enables programme managers to determine if their plan is working and provides a clear method of reporting progress to administrative superiors. An example of this process is the Moma Coastal Fisheries Development Project (MCFDP), in PNG. Funded by the German Agency for Technical Cooperation (GTZ), the project used a range of integrated monitoring indices and targets to determine the usefulness of their plan (Jarchau et al 1995).
The objective was to develop the socio-economic conditions in a rural area of PNG by encouraging commercial fisheries production. A number of divisions, organizations and institutions are involved in the socio-economic development of PNG, and all of these require baseline data and monitoring. The provincial planning unit therefore set up and headed a cross-sectoral task force to develop appropriate indicators to assess and monitor the effectiveness of the fisheries programme and to gather the information. The processed information was then made available to all concerned parties. One officer was assigned to monitor activities and coordinate communications between provincial and national fisheries administrations.
The task force:
- Prepared and published papers
- Informed the participating groups of progress made.
- Assisted provincial departments in planning workshops and preparation of work plans.
- Provided workshops on monitoring issues to support and train monitoring and evaluation units for the different departments.
- Set up linkages and communications schedules between provincial divisions and NGOs involved.
The team jointly defined the role and function of the fisheries officers for the project. The fisheries officers, and other team members, reported to the District Secretary, not the provincial fisheries administration. Since district staff played an important role in the implementation of extension and cross-sector co-ordination, agreements on how personnel would be used was critical to the project. Having the team members from different sectors report to a single manager outside their own department was an excellent idea. Each sector contributed the salary of their representative and helped meet project costs thus establishing excellent communication and motivation between sectors.
The team drew up work plans ranging from monthly work of individual officers to the overall three year project phase. They evaluated the annual work plans every six months, comparing targets with the actual situation. They used the evaluations to re-plan and adjust their work plans as needed.
They met weekly to assure regular communication and co-ordination.
Their monitoring activities focussed on income generation for the coastal villagers. They used participatory techniques to monitor general living conditions and the economic situation, beginning with base line surveys, followed by establishment of targets and then regular impact monitoring. It was important that their data be useful to Provincial and National databases, so they harmonized their data collection activities with all concerned agencies.
Data included:
- Import statistics of several food commodities (meat products and fresh, frozen and canned fish products).
- Input supply information (Prices for fish, fuel, fishing boats and gear, insulated fish boxes are updated twice annually. Updates of bank loan and credit conditions are monitored monthly).
- Activity and financial monitoring included updating budgets on an annual basis per cost center (line item) or activity.
- Sector and Framework Monitoring included coastal population census data, fisheries baseline information, import data of fish and meat products, fish and food price developments, export prices and quantities of important agricultural products as well as input supply information.
- Baseline and impact monitoring of 11 indicators covering income and expenditures, asset ownership and housing situation, health, education, social stratification, division of labor and income, as well as the degree of organization and integration of a coastal village.
- Marketing monitoring included fish landings and sales at the official landing site on a census basis, fish transactions that by-pass the landing site were assessed by monitoring ice purchases by fishermen (the ice-fish ratio is computed to monitor and control the use of subsidized ice).
- A fish category system recorded the different kinds of fish as opposed to the much more complex and time consuming identification of species A taxonomic sampling survey was done every 8th working day recording up to 90 different taxa by weight and numbers.
- Catch and effort surveys were carried out at regular intervals in selected fishing villages. Data were collected by trained fishermen and/or extension officers. The catch rates included information on the season, type of gear, and fishing ground. These data were the basic tool for monitoring resource exploitation and catching efficiency (economic efficiency) of existing and newly introduced fishing gear.
The team designed a data recording system suitable for both manual and electronic data gathering and processing. This included a code system for fishers, traders, and fish taxa for provincial, regional and national use.
In addition to assessment and monitoring, the project organized and conducted training programs for fishers (men and women) and for extension officers.
The team selected the following indices for monitoring.
- The number of people in villages producing more than one ton of fish per year as a measure of the size of population potentially benefiting from the development programme. (23 villages with a population of 8,500)Groups of fishers landing more than one ton of fish per year were considered the direct target groups to the initiative (30 groups based in 15 villages with a total population of 5,000 people). 15% of the total number of active fishing groups landed more than one ton per year and produced 70% of total landings.
- Household economic data for samples of 10 households from selected villages included income, expenditure, subsistence, assets, housing, canoes.
- Source of income from fishing, farming, other, employment, remittance.
- Kind of expenditure, including food, household, clothing, school fees, contributions (Food was the largest expenditure).
- Surplus fish production of coastal villages and fishing groups.
- Transport Efficiency measured as the number of kilograms transported per kilometer.
- Returns from fishing include a cost indicator compared to a profit indicator. The cost indicator is computed from the cost per km traveled based on the most common transport equipment used and returns are based on the average weighted fish price.
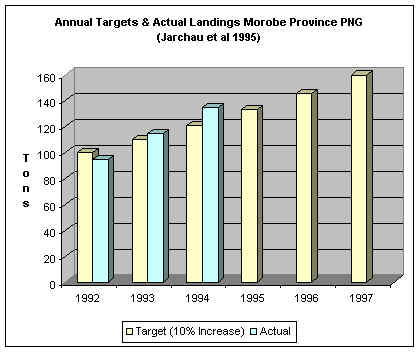
- Annual surplus production landed and marketed each year are compared to targets (a 10% per year increase). All production data is monitored and evaluated monthly.
- Fish landings marketed outside Lae is measured against targets to determine if the project is producing enough fish to be exported to markets in the highlands.
- Projections for commercial operation of the fish market facilities is tracked by monitoring landings (tons) and Value (Kina).
- Landings of ecological groups of fish are monitored to determine if fishers are targeting sustainable populations. The categories include:
- Large and medium size pelagic fish (the primary category targeted for development)
- Small pelagic fish
- Demersal slope fish (deeper water bottom fish)
- Deep water fish
- Reef Fish (less sustainable, not supported for commercial development).
Annual targets used to measure progress towards sustainable development.
Advantages of cross-sectoral environmental assessment
The narrow focus of sectoral research agencies inhibits cross-sectoral co-operation. There are distinct differences in the kinds of information presently gathered and the techniques used between resource managers and ecologists, economists, and sociologists, yet all these investigations focus on the same group of people interacting with the same resource. By shifting the focus to the well being of the people in balance with their environment, it becomes possible to integrate a considerable amount of assessment and monitoring.
Benefits of pooling investigative resources
There are a multitude of benefits of a multi-sectoral approach to data gathering and the creation of development policy. The process of harmonizing information gathering, processing and use will, by itself, reduce policy conflicts. The various line ministries could improve the quality, quantity and usefulness of their data by sharing the research costs and personnel needs with each other and with the communities. They would also benefit from pooling costs, equipment and personnel for:
- development of common indicators useful to all parties
- transportation
- training
- analysis of data
- storage of information
- preparation of reports
- networking the information from the community to the highest levels of government.
- forming policy and
development strategies.
Common information needs between sectors
A number of important features parallel all the information needs. For example:
- A Geographic Information
System (GIS) developed for forestry resource analysis is
equally useful to the complementary use of the land for
Agriculture and Mining. Some of the important features
mapped on the GIS common to all project areas - including
coastal resource development - are:
- Land slope
- Soil types
- Watersheds, rivers, lakes and estuaries.
- Forest cover
- Village sites and population structure
- Farming activities
- Biodiversity analysis
- Roads
- Ports and wharves
- Coastlines
- Political or land ownership boundaries
- Rainfall zones
- Exposure to strong winds
- Places of scenic beauty
- Economic and social data on the people is important to all development programs.
- Market needs for local produce interact with distribution and shipment of fisheries and agricultural produce as well as building materials.
- Trade data (imports and exports) provide important information for fisheries, agriculture, tourism, health and industry.
- Water quality measurements can be used by all sectors to monitor the adverse impacts of forestry, mining, agriculture, industry, and aquaculture.
- The condition of coastal and estuarine habitats reflects the success of the total range of environmental improvement activities of all sectors.
Development of suitable community based environmental and economic indicators should provide an even more integrated list of information needs.